
Linux · Science & Education
LabPlot
LabPlot is a free, open-source application for scientific data visualization, analysis, and plotting on Linux.
- Lizenz
- GPL-2.0+
- Aktuelle Version
- 2.12.1 (15. August 2025)
- Entwickler
- KDE
- Installationen
- 824 (Flathub, 30 Tage)
Was ist LabPlot?
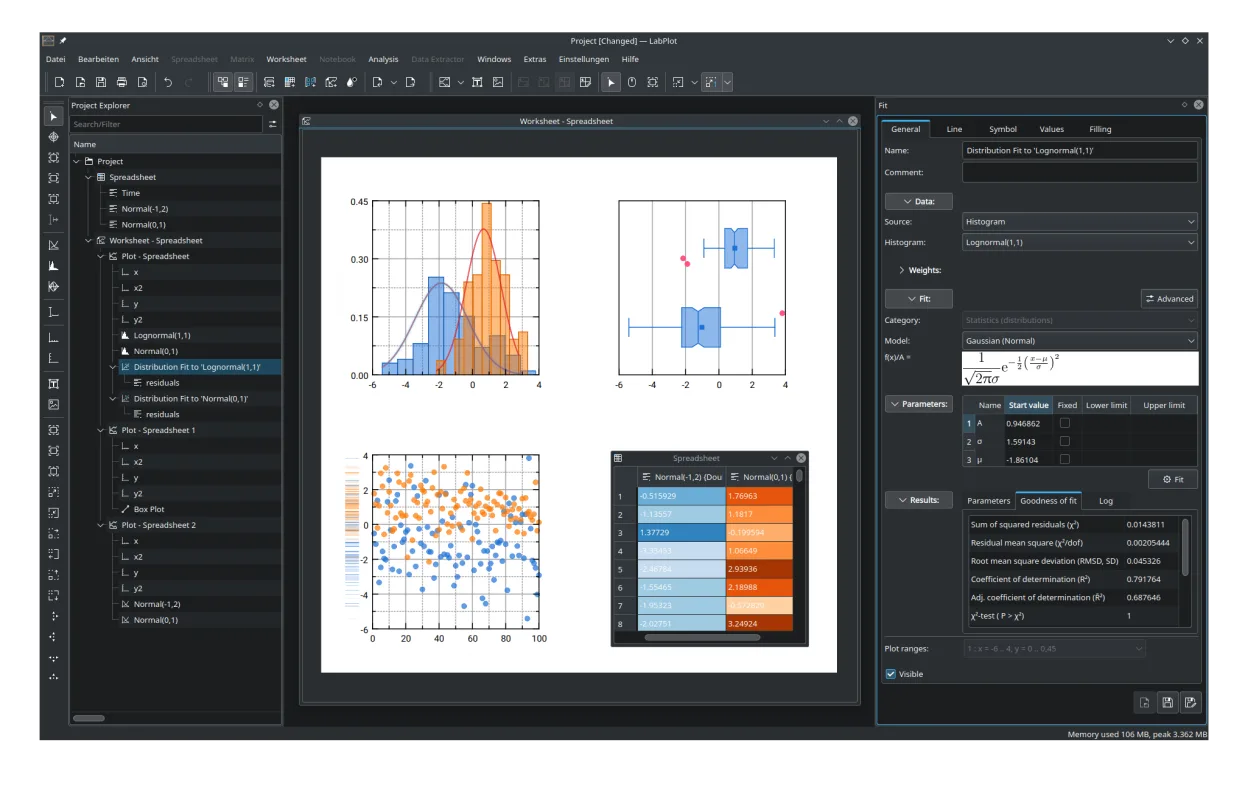
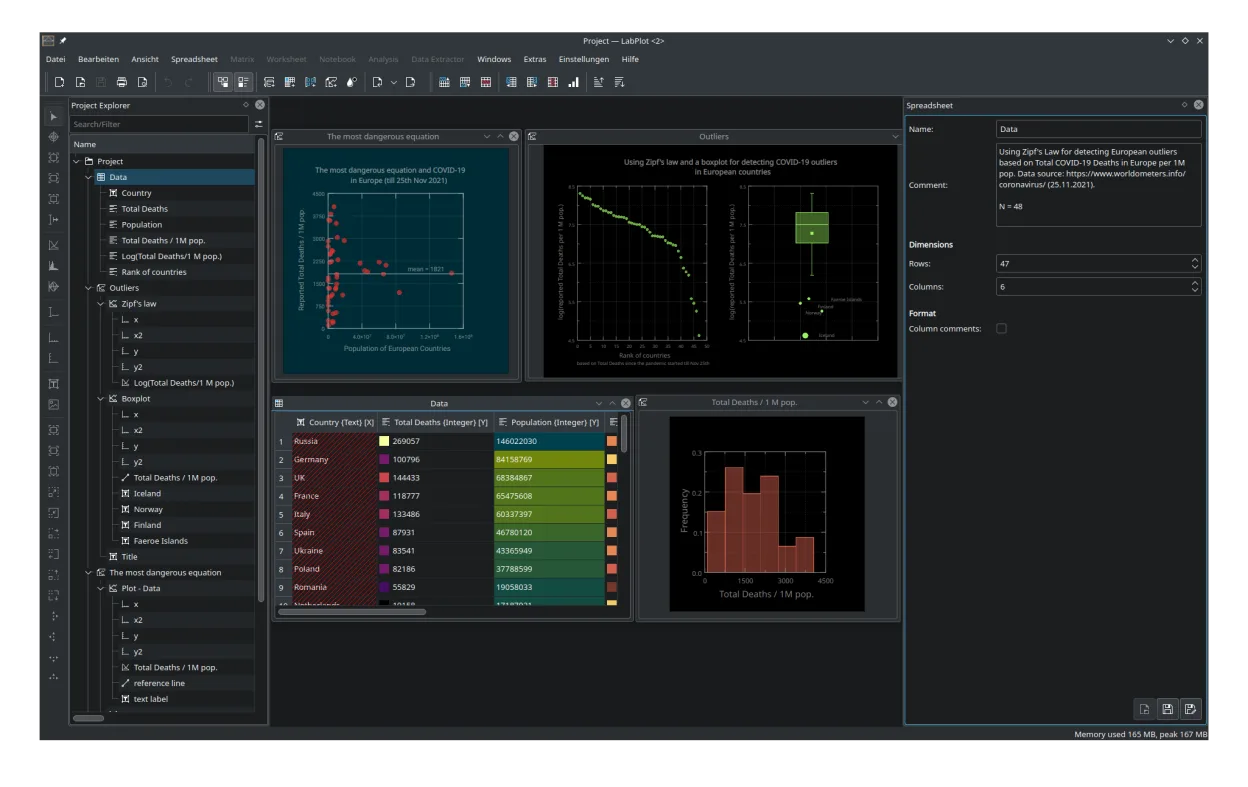
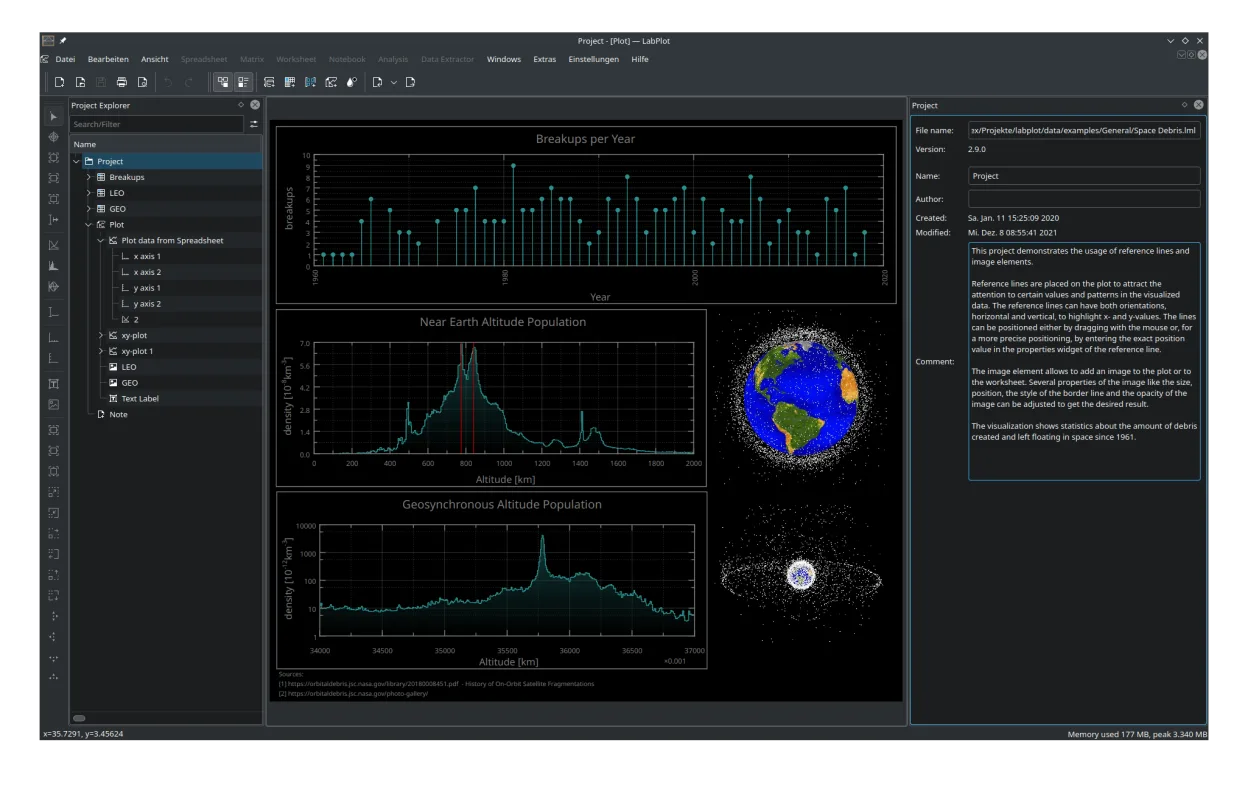
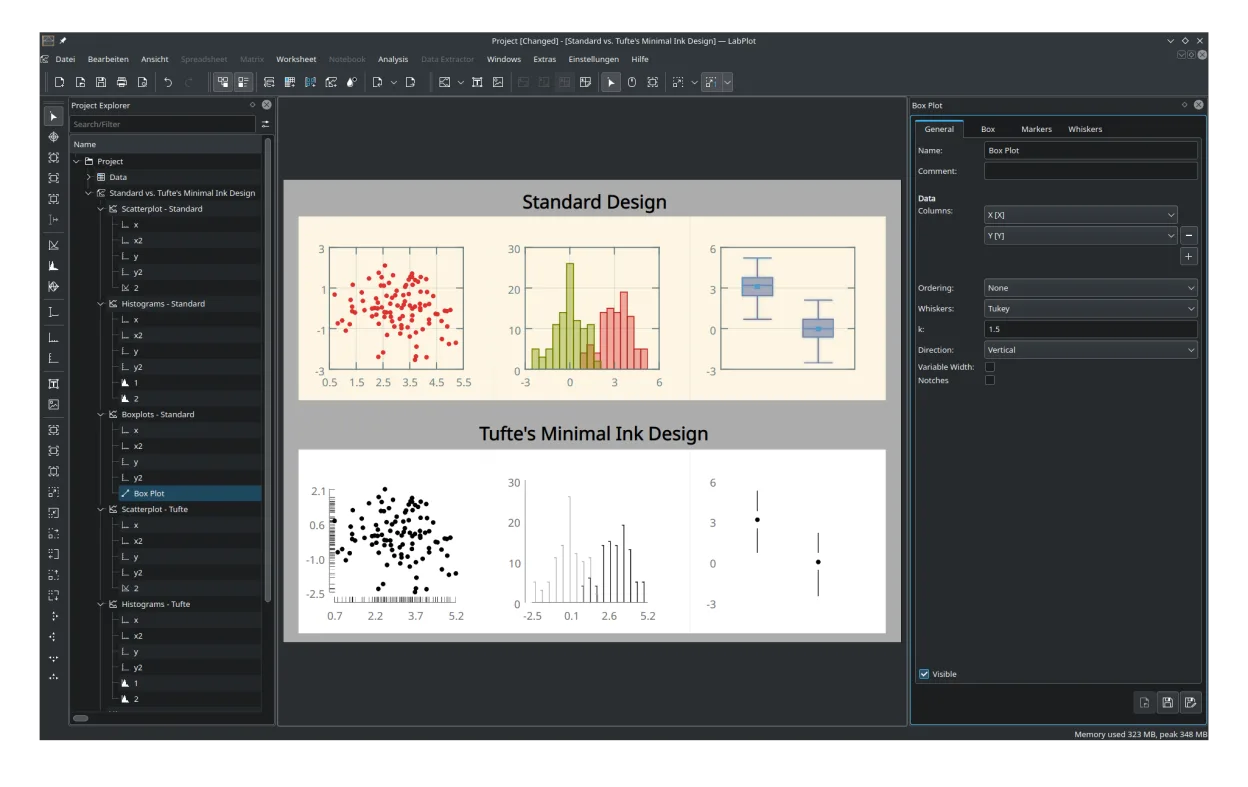
LabPlot is a mature KDE-based application designed for visualizing and analyzing scientific data. Developed since the mid-2000s, it has evolved into a stable tool with regular updates—version 2.12.1 released in August 2025 shows active development. Built on Qt and KDE frameworks, it integrates well on Linux desktops, especially Plasma.
It's aimed at students, researchers, and engineers who need to plot, analyze, and fit experimental or simulation data. If you work with CSV files, spreadsheets, or instrument outputs and need publication-ready graphs, LabPlot offers the core tools without requiring coding. It’s particularly useful when you want a GUI-driven workflow similar to commercial tools.
Compared to OriginLab Origin, LabPlot feels lighter and less polished in advanced features but covers many basics well. The interface is functional, though not as fluid for complex projects. Users switching from Origin may need time to adapt, but the core plotting and data management workflows are familiar.
Ideal für: Scientists and students needing a free, GUI-based tool for 2D data plotting and basic analysis on Linux.
Wichtige Funktionen von LabPlot
- Interactive 2D plotting with multiple axis types
- Integrated spreadsheet for data management
- Support for importing CSV, ASCII, and other data formats
- Curve fitting and mathematical analysis tools
- Export to PNG, SVG, PDF, and other graphic formats
- Project-based file management with reusable templates
- Error bar and uncertainty visualization
- Live data updates and formula-based columns
Vorteile
- Free and open-source with no usage restrictions
- Native Linux integration, especially on KDE Plasma
- Regular updates and active community support
- Supports common scientific plotting needs out of the box
- Project files are easy to organize and reuse
Nachteile
- Fewer advanced analysis features compared to Origin
- Steeper learning curve for complex fitting routines
- Limited 3D plotting capabilities
- Smaller user base means fewer tutorials
Windows-Programme, die LabPlot ersetzt
 OriginLab Origin
LabPlot unter Linux installieren
flatpak install flathub org.kde.labplotsudo apt install labplotsudo apt install labplotsudo dnf install LabPlotsudo pacman -S labplotsudo zypper install labplotTipps für Windows-Umsteiger
If you're coming from Origin, note that LabPlot uses .lpx for project files—no direct compatibility. Import your ASCII or CSV data as in Origin, but expect fewer automation options. Keyboard shortcuts differ; spend time customizing them under Settings. Workflows are similar: import data, create a plot, then apply fits. Use the project explorer to manage multiple sheets and plots efficiently.
Neueste Versionen
- 2.12.1 —
- 2.12.0 —
- 2.11.1 —
- 2.11.0 —
LabPlot: häufige Fragen
Can LabPlot open Origin (.opj) files?
No, LabPlot cannot open Origin project files directly. You’ll need to export data from Origin as CSV or ASCII and import it into LabPlot.
Is LabPlot available on non-KDE desktops?
Yes, LabPlot runs on any Linux desktop environment. It’s packaged for major distributions and available via Flathub, though it integrates best with KDE Plasma.
Does LabPlot support nonlinear curve fitting?
Yes, it supports user-defined and built-in fitting models, including nonlinear regression, though the interface is less streamlined than Origin’s.
How does LabPlot compare to QtiPlot?
Both are Origin alternatives. QtiPlot has a more Origin-like interface, but LabPlot is fully free and more tightly integrated with Linux desktop environments.
Aktualisiert am