

Linux · Science & Education
QtiPlot
QtiPlot is a cross‑platform scientific graphing and data analysis tool similar to Origin or SigmaPlot.
- Lizenz
- GPL-3.0
- Aktuelle Version
- —
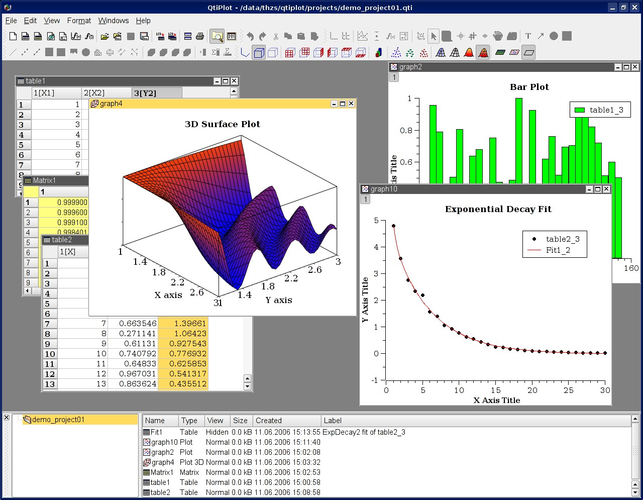
Was ist QtiPlot?
QtiPlot was first released in 2004 as a Qt‑based alternative to commercial graphing packages. Over the years it added features such as curve fitting, statistical analysis, and support for multiple data formats, making it a mature option for researchers who need a free tool.
It targets scientists, engineers, and students who regularly plot experimental data and perform curve fitting. The interface is familiar to users of Origin and SigmaPlot, with menus, toolbars, and a worksheet‑style data editor.
Compared to the Windows tools, QtiPlot feels lightweight and responsive on Linux. It lacks some advanced 3‑D rendering options of Origin, but its scripting via Python and built‑in analysis functions make it a solid, no‑cost replacement.
Ideal für: Researchers and students needing a free, cross‑platform graphing tool with scripting capabilities.
Wichtige Funktionen von QtiPlot
- Worksheet‑style data editor
- Interactive 2‑D and 3‑D plots
- Non‑linear curve fitting
- Statistical tests (ANOVA, t‑test)
- Python scripting support
- Export to PDF, PostScript, SVG, PNG
- Import CSV, TXT, Excel, Gnuplot
Vorteile
- Free and open source
- Cross‑platform (Linux, Windows, macOS)
- Python scripting for automation
- Good documentation and community support
- Lightweight compared to Origin
Nachteile
- Limited 3‑D rendering quality
- Occasional stability issues on older Linux kernels
- Fewer advanced analysis modules than paid counterparts
- Learning curve for Python scripting
Windows-Programme, die QtiPlot ersetzt
 OriginLab Origin
 SigmaPlot
Tipps für Windows-Umsteiger
Export your Origin or SigmaPlot projects as .csv or .txt and import them into QtiPlot’s worksheet. Use the File → Import → Spreadsheet menu. Keyboard shortcuts differ: QtiPlot uses Ctrl+S for save, Ctrl+Z for undo, and Ctrl+Shift+F for fitting. The fitting dialog is simpler; you may need to set parameters manually. Workflow is linear: load data → plot → fit → export. Scripts can be written in Python to automate repetitive tasks.
QtiPlot: häufige Fragen
Can QtiPlot open Origin project files?
No, QtiPlot cannot read .opj files directly. Export the data from Origin as CSV or TXT and then import into QtiPlot.
Is QtiPlot still maintained?
Yes, the latest stable release is 2.1.3, available from the project website and most Linux distributions.
Does QtiPlot support 3‑D surface plots?
It supports basic 3‑D surface plots, but the rendering is less advanced than Origin’s 3‑D engine.
Can I use Python scripts in QtiPlot?
Yes, QtiPlot includes a Python console and API for scripting plots and data analysis.
Aktualisiert am